
Unveiling Social Media Sentiments with Python: A Comprehensive Guide to Sentiment Analysis and Visualization
This guide will walk you through the process of analyzing social media sentiment data using Python. We will cover data preparation, sentiment analysis, trend visualization, and report generation.
Table of Contents
Introduction
Social media sentiment analysis involves extracting opinions from text data to categorize them into sentiments such as positive, negative, and neutral. This helps in understanding public opinion about various topics, products, or services.
Data Preparation
Objective: Prepare social media sentiment data for analysis.
- Load the Data: Import data from a CSV file.
- Check for Missing Values: Identify and handle missing values.
- Convert Dates: Ensure the date column is in datetime format.
- Set Index: Set the date column as the index.
- Clean Text Data: Preprocess text data for sentiment analysis.
import pandas as pd

# Load the dataset
data_url = 'https://raw.githubusercontent.com/EdulaneDotCo/kaggle/main/data/social_media_sentimate_data.csv'
df_sentiments = pd.read_csv(data_url)

# Print the first few rows to verify the column names
print(df_sentiments.head())

# Check for missing values
print(df_sentiments.isnull().sum())

# Drop rows with missing values in 'New_Date' and 'clean_tweet' columns
df_sentiments.dropna(subset=['New_Date', 'clean_tweet'], inplace=True)

# Convert 'New_Date' column to datetime
df_sentiments['New_Date'] = pd.to_datetime(df_sentiments['New_Date'])

# Set 'New_Date' as the index
df_sentiments.set_index('New_Date', inplace=True)

# Display the prepared data
print(df_sentiments.head())
Explanation:
- Load the Data: We use
pd.read_csvto load the sentiment data from a CSV file. - Check for Missing Values: We use
df_sentiments.isnull().sum()to identify missing values and drop rows with missing values in the ‘New_Date’ and ‘clean_tweet’ columns usingdropna. - Convert Dates: We ensure the ‘New_Date’ column is in datetime format using
pd.to_datetime. - Set Index: We set the ‘New_Date’ column as the index using
df_sentiments.set_index.
Output:
                        Date                                              Tweet  ... sentiment_score sentiment
0  2023-04-08 03:31:08+00:00  OpenAI’s GPT-4 Just Got Supercharged! #ai #Cha...  ...        0.917779  positive
1  2023-04-08 03:30:51+00:00  "Classical art" is struggling - not changed th...  ...        0.515711   neutral
2  2023-04-08 03:30:00+00:00  Alibaba invites businesses to trial 'ChatGPT r...  ...        0.924410   neutral
3  2023-04-08 03:28:59+00:00  Trying to stop students from using #AI and #ch...  ...        0.636237  negative
4  2023-04-08 03:28:31+00:00  I Asked ChatGPT's AI Chatbot How Can I Earn Cr...  ...        0.916693   neutral

[5 rows x 22 columns]
Date               0
Tweet              0
Url                0
User               0
UserCreated        0
UserVerified       0
UserFollowers      0
UserFriends        0
Retweets           0
Likes              0
Location           0
Description        0
New_Date           0
Time               0
Hour               0
Day                0
TweetStr           0
hashtags           0
clean_tweet        1
sentiment_label    0
sentiment_score    0
sentiment          0
dtype: int64
                                 Date                                              Tweet  ... sentiment_score sentiment
New_Date                                                                                  ...
2023-04-08  2023-04-08 03:31:08+00:00  OpenAI’s GPT-4 Just Got Supercharged! #ai #Cha...  ...        0.917779  positive
2023-04-08  2023-04-08 03:30:51+00:00  "Classical art" is struggling - not changed th...  ...        0.515711   neutral
2023-04-08  2023-04-08 03:30:00+00:00  Alibaba invites businesses to trial 'ChatGPT r...  ...        0.924410   neutral
2023-04-08  2023-04-08 03:28:59+00:00  Trying to stop students from using #AI and #ch...  ...        0.636237  negative
2023-04-08  2023-04-08 03:28:31+00:00  I Asked ChatGPT's AI Chatbot How Can I Earn Cr...  ...        0.916693   neutral

[5 rows x 21 columns]
Sentiment Analysis
Objective: Perform sentiment analysis to categorize sentiments into positive, negative, and neutral.
- Install and Import Required Libraries: Install
nltkand import necessary libraries. - Load Sentiment Analyzer: Use
nltk‘s VADER sentiment analyzer. - Analyze Sentiments: Calculate sentiment scores and categorize them.
# Install NLTK if not already installed
# !pip install nltk

import nltk
from nltk.sentiment.vader import SentimentIntensityAnalyzer

# Download VADER lexicon
nltk.download('vader_lexicon')

# Load VADER sentiment analyzer
sid = SentimentIntensityAnalyzer()

# Calculate sentiment scores for each tweet
df_sentiments['sentiment_scores'] = df_sentiments['clean_tweet'].apply(lambda tweet: sid.polarity_scores(tweet))

# Extract compound score
df_sentiments['compound_score'] = df_sentiments['sentiment_scores'].apply(lambda score_dict: score_dict['compound'])

# Categorize sentiments based on compound score
df_sentiments['sentiment'] = df_sentiments['compound_score'].apply(lambda score: 'positive' if score >= 0.05 else ('negative' if score <= -0.05 else 'neutral'))

# Display the sentiment analysis results
print(df_sentiments[['clean_tweet', 'compound_score', 'sentiment']].head())
Explanation:
- Install and Import Required Libraries: We use
nltkfor sentiment analysis. - Load Sentiment Analyzer: We load the VADER sentiment analyzer using
SentimentIntensityAnalyzer. - Analyze Sentiments: We calculate sentiment scores for each tweet, extract the compound score, and categorize the sentiments into positive, negative, or neutral.
Output:
[nltk_data] Downloading package vader_lexicon to
[nltk_data] C:\Users\SOFTRAW6261\AppData\Roaming\nltk_data...
[nltk_data] Package vader_lexicon is already up-to-date!
clean_tweet compound_score sentiment
New_Date
2023-04-08 openai’s gpt4 just got supercharged! 0.0000 neutral
2023-04-08 classical art" is struggling not changed the ... -0.2500 negative
2023-04-08 alibaba invites businesses to trial chatgpt ri... 0.0000 neutral
2023-04-08 trying to stop students from using and is like... -0.2263 negative
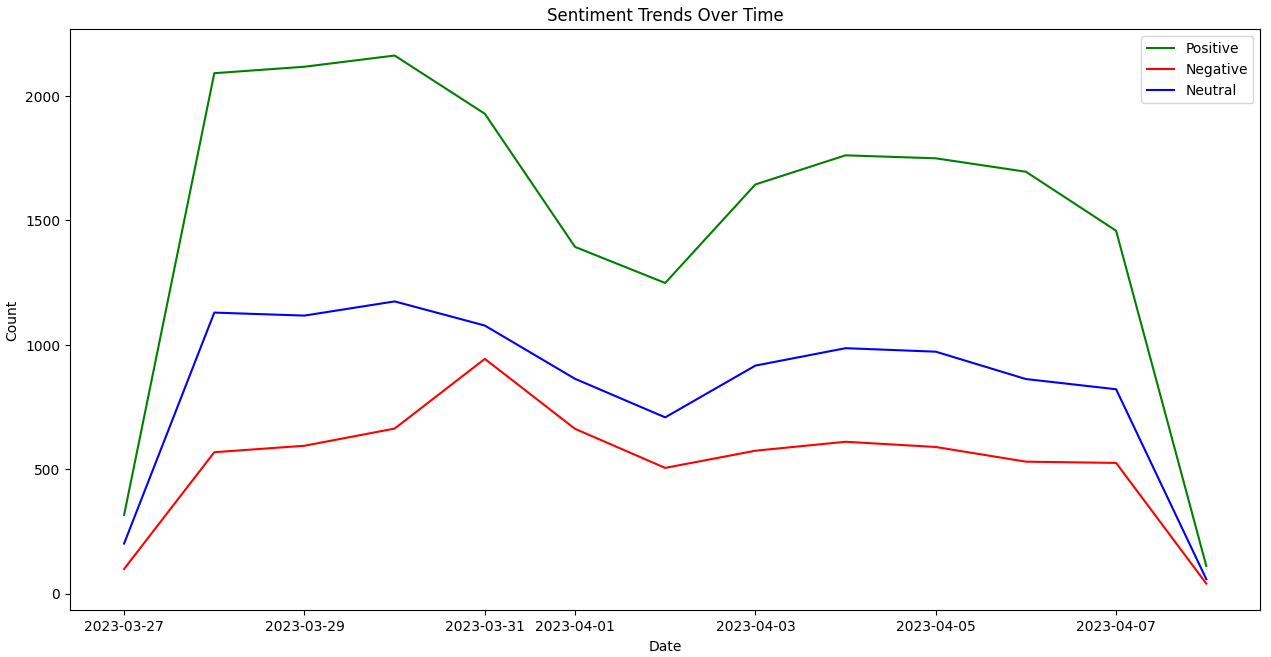
2023-04-08 i asked chatgpts ai chatbot how can i earn cry... 0.0000 neutralTrend Visualization
Objective: Visualize sentiment trends over time.
- Resample Data: Aggregate sentiment counts on a daily basis.
- Plot Sentiment Trends: Visualize the trends of positive, negative, and neutral sentiments over time.
import matplotlib.pyplot as plt

# Resample data to daily sentiment counts
# Initialize an empty DataFrame to store daily sentiment counts
df_daily_sentiments = pd.DataFrame(index=pd.date_range(start=df_sentiments.index.min(), end=df_sentiments.index.max()))

# Aggregate sentiment counts by day
df_daily_sentiments['positive'] = df_sentiments[df_sentiments['sentiment'] == 'positive'].resample('D').size()
df_daily_sentiments['negative'] = df_sentiments[df_sentiments['sentiment'] == 'negative'].resample('D').size()
df_daily_sentiments['neutral'] = df_sentiments[df_sentiments['sentiment'] == 'neutral'].resample('D').size()

# Fill NaN values with 0 to represent days with no sentiments
df_daily_sentiments.fillna(0, inplace=True)

# Plot sentiment trends
plt.figure(figsize=(12, 6))
plt.plot(df_daily_sentiments.index, df_daily_sentiments['positive'], label='Positive', color='g')
plt.plot(df_daily_sentiments.index, df_daily_sentiments['negative'], label='Negative', color='r')
plt.plot(df_daily_sentiments.index, df_daily_sentiments['neutral'], label='Neutral', color='b')
plt.title('Sentiment Trends Over Time')
plt.xlabel('Date')
plt.ylabel('Count')
plt.legend()
plt.show()
Explanation:
- Resample Data: We resample the sentiment data to aggregate counts on a daily basis using
resampleandsizefor each sentiment category (positive, negative, neutral). We initialize an empty DataFramedf_daily_sentimentswith a date range from the minimum to the maximum date in the dataset to ensure all dates are represented. - Fill NaN Values: We fill any
NaNvalues with 0 to represent days with no sentiments. - Plot Sentiment Trends: We use
matplotlibto plot the trends of positive, negative, and neutral sentiments over time.
Report Generation
Objective: Generate reports to summarize insights from the sentiment analysis.
- Summarize Data: Create summary statistics of sentiments.
- Generate Plots: Save plots of sentiment trends.
- Export to CSV: Export the summarized data to a CSV file.
# Summarize data
sentiment_summary = df_daily_sentiments.describe()

# Generate plots and save them
plt.figure(figsize=(12, 6))
plt.plot(df_daily_sentiments.index, df_daily_sentiments['positive'], label='Positive', color='g')
plt.plot(df_daily_sentiments.index, df_daily_sentiments['negative'], label='Negative', color='r')
plt.plot(df_daily_sentiments.index, df_daily_sentiments['neutral'], label='Neutral', color='b')
plt.title('Sentiment Trends Over Time')
plt.xlabel('Date')
plt.ylabel('Count')
plt.legend()
plt.savefig('sentiment_trends.png')
plt.show()

# Export summarized data to CSV
sentiment_summary.to_csv('sentiment_summary.csv')

print("Report generated: 'sentiment_summary.csv' and 'sentiment_trends.png'")
Explanation:
- Summarize Data: We create summary statistics of the daily sentiment counts using
describe. - Generate Plots: We plot the sentiment trends and save the plot as an image file.
- Export to CSV: We export the summary statistics to a CSV file using
to_csv.
Conclusion
By following these steps, you can effectively analyze social media sentiments, identify trends, and generate insightful reports. This structured approach ensures you cover all essential aspects of sentiment analysis and make data-driven decisions based on the findings. Feel free to adjust the code and the explanations according to your specific needs and data characteristics.
Professional LinkedIn Post Format
Hello LinkedIn Community!
Title : Analyzing Social Media Sentiments Using Python
I’m excited to share my latest project where I delve into the world of social media sentiment analysis using Python. This comprehensive guide will walk you through each step of the process, from data preparation to sentiment analysis, trend visualization, and report generation.
Check out the full project on Kaggle: [Link to Kaggle Notebook]
🚀 Why Sentiment Analysis?
Social media sentiment analysis is a powerful tool to understand public opinion on various topics, products, and services. By categorizing sentiments into positive, negative, and neutral, businesses and researchers can make informed, data-driven decisions.
🛠️ Project Breakdown
1. Data Preparation
We start by preparing our social media sentiment data, ensuring it is clean and ready for analysis.
import pandas as pd

# Load the dataset
data_url = 'https://raw.githubusercontent.com/EdulaneDotCo/kaggle/main/data/social_media_sentimate_data.csv'
df_sentiments = pd.read_csv(data_url)

# Check for missing values and drop rows with missing 'New_Date' and 'clean_tweet'
df_sentiments.dropna(subset=['New_Date', 'clean_tweet'], inplace=True)

# Convert 'New_Date' to datetime and set as index
df_sentiments['New_Date'] = pd.to_datetime(df_sentiments['New_Date'])
df_sentiments.set_index('New_Date', inplace=True)
2. Sentiment Analysis
Next, we perform sentiment analysis using NLTK’s VADER sentiment analyzer to categorize the sentiments of each social media post.
import nltk
from nltk.sentiment.vader import SentimentIntensityAnalyzer

# Download VADER lexicon and initialize the sentiment analyzer
nltk.download('vader_lexicon')
sid = SentimentIntensityAnalyzer()

# Calculate sentiment scores and categorize sentiments
df_sentiments['sentiment_scores'] = df_sentiments['clean_tweet'].apply(lambda tweet: sid.polarity_scores(tweet))
df_sentiments['compound_score'] = df_sentiments['sentiment_scores'].apply(lambda score_dict: score_dict['compound'])
df_sentiments['sentiment'] = df_sentiments['compound_score'].apply(lambda score: 'positive' if score >= 0.05 else ('negative' if score <= -0.05 else 'neutral'))
3. Trend Visualization
We then visualize the sentiment trends over time, which helps in understanding how sentiments change across different periods.
import matplotlib.pyplot as plt

# Aggregate daily sentiment counts
df_daily_sentiments = df_sentiments.resample('D').size().unstack(fill_value=0)

# Plot sentiment trends
plt.figure(figsize=(12, 6))
df_daily_sentiments.plot(title='Sentiment Trends Over Time', xlabel='Date', ylabel='Count', figsize=(12, 6))
plt.show()
4. Report Generation
Finally, we generate a report summarizing our findings, including visualizations and export the data for further analysis.
# Summarize data and export to CSV
sentiment_summary = df_daily_sentiments.describe()
sentiment_summary.to_csv('sentiment_summary.csv')

# Save the plot as an image
plt.savefig('sentiment_trends.png')
print("Report generated: 'sentiment_summary.csv' and 'sentiment_trends.png'")
📝 Conclusion
This project demonstrates how to leverage Python for powerful social media sentiment analysis, providing valuable insights into public opinion. Whether you’re a data analyst, developer, or business professional, understanding sentiment trends can help you make more informed decisions.
💡 Key Takeaways:
- Data Preparation: Clean and preprocess your data meticulously.
- Sentiment Analysis: Use tools like NLTK’s VADER to extract meaningful insights.
- Visualization: Always visualize your data to uncover hidden trends.
- Reporting: Summarize and export your findings for further analysis.
🔗 Explore the full project on Kaggle: [Link to Kaggle Notebook]
I hope you find this project insightful and useful. Feel free to reach out if you have any questions or would like to discuss further. Happy analyzing!
#DataScience #SentimentAnalysis #Python #Kaggle #SocialMedia #DataAnalytics #MachineLearning #NLP #DataVisualization
Kaggle Notebook
Description
“Explore the intricacies of social media sentiment analysis with this comprehensive Python guide. This notebook covers the complete process from data preparation, sentiment analysis, trend visualization, to report generation using real-world social media data. Ideal for developers and data analysts, this project demonstrates how to leverage the power of Python and NLTK to extract and visualize insights from social media platforms.”
Introduction
Social media sentiment analysis is a powerful tool to gauge public opinion on various topics, products, or services. By categorizing sentiments into positive, negative, and neutral, businesses and researchers can make data-driven decisions. This notebook provides a step-by-step guide to analyzing social media sentiment data using Python.
Dataset Information
The dataset used in this analysis contains social media sentiment data from various platforms. Each entry includes:
- New_Date: The date and time of the social media post.
- clean_tweet: The cleaned text of the social media post.
- sentiment: The sentiment label (positive, negative, neutral) assigned to each post.
The dataset is available at: Social Media Sentiment Data.
Steps Included in the Notebook
1. Data Preparation
- Loading the Data: Import data from a CSV file.
- Handling Missing Values: Identify and handle missing values.
- Date Conversion: Ensure the date column is in datetime format.
- Index Setting: Set the date column as the index.
- Text Data Cleaning: Preprocess text data for sentiment analysis.
import pandas as pd

# Load the dataset
data_url = 'https://raw.githubusercontent.com/EdulaneDotCo/kaggle/main/data/social_media_sentimate_data.csv'
df_sentiments = pd.read_csv(data_url)

# Print the first few rows to verify the column names
print(df_sentiments.head())

# Check for missing values
print(df_sentiments.isnull().sum())

# Drop rows with missing values in 'New_Date' and 'clean_tweet' columns
df_sentiments.dropna(subset=['New_Date', 'clean_tweet'], inplace=True)

# Convert 'New_Date' column to datetime
df_sentiments['New_Date'] = pd.to_datetime(df_sentiments['New_Date'])

# Set 'New_Date' as the index
df_sentiments.set_index('New_Date', inplace=True)

# Display the prepared data
print(df_sentiments.head())
2. Sentiment Analysis
- Sentiment Analysis: Use NLTK’s VADER sentiment analyzer to categorize sentiments.
# Install NLTK if not already installed
# !pip install nltk

import nltk
from nltk.sentiment.vader import SentimentIntensityAnalyzer

# Download VADER lexicon
nltk.download('vader_lexicon')

# Load VADER sentiment analyzer
sid = SentimentIntensityAnalyzer()

# Calculate sentiment scores for each tweet
df_sentiments['sentiment_scores'] = df_sentiments['clean_tweet'].apply(lambda tweet: sid.polarity_scores(tweet))

# Extract compound score
df_sentiments['compound_score'] = df_sentiments['sentiment_scores'].apply(lambda score_dict: score_dict['compound'])

# Categorize sentiments based on compound score
df_sentiments['sentiment'] = df_sentiments['compound_score'].apply(lambda score: 'positive' if score >= 0.05 else ('negative' if score <= -0.05 else 'neutral'))

# Display the sentiment analysis results
print(df_sentiments[['clean_tweet', 'compound_score', 'sentiment']].head())
3. Trend Visualization
- Trend Visualization: Aggregate sentiment counts on a daily basis and plot the trends over time.
import matplotlib.pyplot as plt

# Resample data to daily sentiment counts
# Initialize an empty DataFrame to store daily sentiment counts
df_daily_sentiments = pd.DataFrame(index=pd.date_range(start=df_sentiments.index.min(), end=df_sentiments.index.max()))

# Aggregate sentiment counts by day
df_daily_sentiments['positive'] = df_sentiments[df_sentiments['sentiment'] == 'positive'].resample('D').size()
df_daily_sentiments['negative'] = df_sentiments[df_sentiments['sentiment'] == 'negative'].resample('D').size()
df_daily_sentiments['neutral'] = df_sentiments[df_sentiments['sentiment'] == 'neutral'].resample('D').size()

# Fill NaN values with 0 to represent days with no sentiments
df_daily_sentiments.fillna(0, inplace=True)

# Plot sentiment trends
plt.figure(figsize=(12, 6))
plt.plot(df_daily_sentiments.index, df_daily_sentiments['positive'], label='Positive', color='g')
plt.plot(df_daily_sentiments.index, df_daily_sentiments['negative'], label='Negative', color='r')
plt.plot(df_daily_sentiments.index, df_daily_sentiments['neutral'], label='Neutral', color='b')
plt.title('Sentiment Trends Over Time')
plt.xlabel('Date')
plt.ylabel('Count')
plt.legend()
plt.show()
4. Report Generation
- Report Generation: Summarize the data and export results to CSV files and save sentiment trend plots.
# Summarize data
sentiment_summary = df_daily_sentiments.describe()

# Generate plots and save them
plt.figure(figsize=(12, 6))
plt.plot(df_daily_sentiments.index, df_daily_sentiments['positive'], label='Positive', color='g')
plt.plot(df_daily_sentiments.index, df_daily_sentiments['negative'], label='Negative', color='r')
plt.plot(df_daily_sentiments.index, df_daily_sentiments['neutral'], label='Neutral', color='b')
plt.title('Sentiment Trends Over Time')
plt.xlabel('Date')
plt.ylabel('Count')
plt.legend()
plt.savefig('sentiment_trends.png')
plt.show()

# Export summarized data to CSV
sentiment_summary.to_csv('sentiment_summary.csv')

print("Report generated: 'sentiment_summary.csv' and 'sentiment_trends.png'")
Conclusion
This notebook provides a comprehensive guide to analyzing social media sentiments using Python. By following these steps, you can effectively prepare data, perform sentiment analysis, visualize trends, and generate insightful reports. This structured approach ensures you cover all essential aspects of sentiment analysis and make data-driven decisions based on the findings.